


Monthly Economic and Market Summary
Stocks post double-digit gains in Q2
| Monthly Return | Year-to-Date Return | 1-Year Return | |
|---|---|---|---|
| S&P 500 Large Cap | -0.95% | 15.20% | 10.19% |
| S&P Midcap | 3.59% | 14.47% | 17.33% |
| S&P Small Cap 600 | 7.29% | 19.69% | 23.98% |
| MSCI EAFE (Dev. Foreign) | 0.09% | 11.08% | 9.90% |
| MSCI Emerging Markets | -1.37% | 24.14% | 24.00 |
| Barclay’s 1-3 Year Gov’t Bonds | 0.05% | 0.37% | 0.64% |
| Barclay’s Gov’t Credit Bonds | 0.10% | 0.43% | 0.40% |
Market Return Data (as of 6/30): Bloomberg
-
Stocks Post Strong Q2 Despite Weaker June–The S&P 500 index declined nearly 1.0% in June, reflecting weaker performance in the Magnificent 7 stocks and was partially offset by significant gains in semiconductor and memory stocks. Despite the monthly setback, the S&P 500 index rose 15.2% in Q2, marking the strongest quarter on record since the pandemic-driven rebound in 2020. Returns have not been equal across markets. International emerging markets and domestic small-cap stocks continue to lead, up 24.1% and 19.7% in the quarter, respectively.
-
Bonds Market Modestly Positive–The bond market stabilized in June with the 10-year Treasury yield ending the month at 4.42%, following a temporary surge to 4.67% in mid-May. Bonds finished the month and the quarter in positive territory.
-
Consumer Confidence Edges Higher–June Consumer Confidence improved modestly to 91.2, exceeding May’s revised reading of 90.6 but falling short of the 94.7 consensus estimate. Lower gasoline prices in recent weeks appear to have eased consumer concerns surrounding inflation.
-
Inflation Ticks Up–Core Personal Consumption Expenditures (PCE), the Federal Reserve’s preferred measure of inflation excluding food and energy, increased at an annual rate of 3.4% in May, marking the strongest year-over-year increase since October 2023 and remained well above the Fed’s 2.0% inflation target. Including food and energy, May PCE rose 4.1% compared to the same month last year
-
Labor Market Softens–The U.S. job market showed signs of slowing in June on weaker than expected hiring in the seasonally important hospitality and leisure sector. Non-farm payrolls increased 57,000 in June, well below expectations for an increase of 115,000. The May jobs number was revised down to 129,000 from 172,000. The unemployment rate dropped to 4.2% from 4.3%.
-
Manufacturing Still Expanding–The June ISM Manufacturing PMI registered 53.3, marking the sixth straight month in expansionary territory. New orders remained healthy and prices paid eased, suggesting demand remained resilient while cost pressures may be moderating. A reading above 50 indicates expansion.
Warsh ushers in a new era at the Fed
Kevin Warsh’s first Federal Reserve meeting as chairman did not change interest rates, but it did change the tone around monetary policy. The Fed held rates steady, as expected, yet the message from the meeting was more hawkish than investors had anticipated. The clearest signal came from the Fed’s dot plot, shown below, where nearly half of officials projected at least one rate increase before year-end and the median year-end rate forecast moved higher. That shift suggested policymakers are no longer leaning toward rate cuts as the obvious next move. With inflation still running above the Fed’s 2% target, the meeting served as a reminder that price stability remains the central bank’s first concern.
Warsh also appears intent on changing how the Fed communicates with the public and financial markets. The policy statement was much shorter than in prior meetings, forward guidance was removed, and Warsh himself did not submit a projection to the dot plot. That marks a break from the Powell era, when investors often looked to the Fed’s statement and projections for clues about what would come next. Under Warsh, the Fed may say less and preserve more flexibility, even if that leaves markets with less certainty. The shift is not just about style; it changes how investors interpret policy risk.
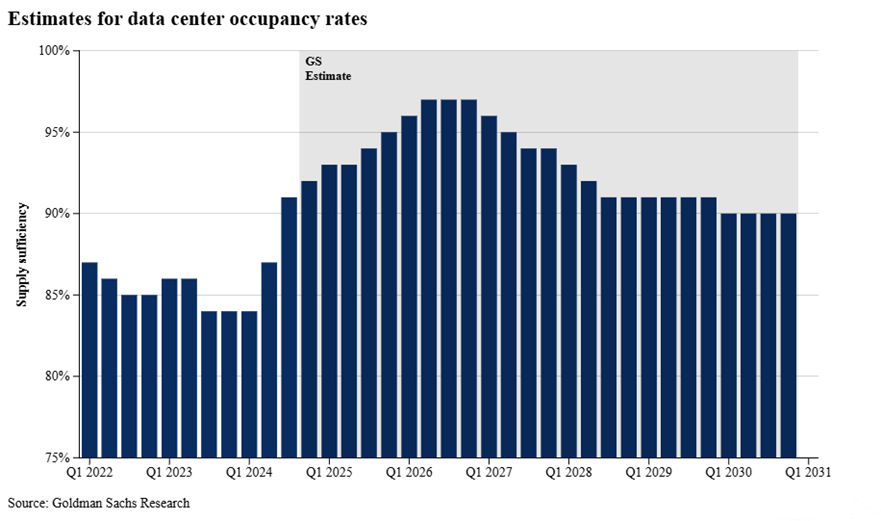
The economic question at the center of Warsh’s early tenure is whether the artificial intelligence boom is a productivity story or an inflation story. Data centers, electricity demand, semiconductor spending and rising technology valuations are already stimulating demand, even if the productivity benefits may take longer to appear. At the same time, higher oil and energy prices tied to geopolitical tensions could feed into headline inflation and consumer expectations. That combination has pushed markets to reprice the policy outlook, with bond markets now reflecting a greater likelihood that the Fed’s next move is a rate hike from the current 3.50 – 3.75% range rather than the cut investors had previously expected.
Investment, Securities and Insurance Products:
NOT
FDIC INSUREDNOT BANK
GUARANTEEDMAY
LOSE VALUENOT INSURED BY ANY
FEDERAL AGENCYNOT A
DEPOSITAssociated Bank and Associated Bank Private Wealth are marketing names Associated Banc-Corp (AB-C) uses for products and services offered by its affiliates. Securities and investment advisory services are offered by Associated Investment Services, Inc. (AIS), member FINRA/SIPC; insurance products are offered by licensed agents of AIS; deposit and loan products and services are offered through Associated Bank, N.A. (ABNA); investment management, fiduciary, administrative and planning services are offered through Associated Trust Company, N.A. (ATC); and Kellogg Asset Management, LLC® (KAM) provides investment management services to AB-C affiliates. AIS, ABNA, ATC, and KAM are all direct or indirect, wholly-owned subsidiaries of AB-C. AB-C and its affiliates do not provide tax, legal or accounting advice. Please consult with your advisors regarding your individual situation. (1024)
Readers should not consider this update of the economic and investment environment as analysis upon which to make investment decisions or recommendations of strategies or particular securities. Always consider whether particular investments are appropriate for your situation and consult with your financial advisor regarding the appropriateness of any recommendation to your investment objective. Past performance is no guarantee of future returns. Read the prospectus before investing; it contains information about a mutual fund’s risks, investment objectives, fees and expenses. You may obtain a prospectus for any mutual fund from your financial advisor or directly from the mutual fund company you choose.