


Monthly Foreign Exchange Review
Two macro issues dominated September markets: The Strait of Hormuz and US bond yields. The USD rallied strongly in response to higher oil prices and bond yields, and most currencies lost against the USD in September.
USD Strong, US Economy Showing Strength, Oil rallies on Strait flare-up
The ongoing closure of the Strait of Hormuz and the escalating US-Iran standoff roiled markets in the second half of September. Attacks flared up and kept global energy markets in a state of sustained disruption and volatility. This drove Brent crude toward $123 a barrel spot price by month-end vs. just $92/bb in the USA due to US shale production. Reports of increased tanker flow through the straight ran up against statements by China it was halting exports of refined product. The conflict is now very clearly impacting Europe and Asia oil prices more than the US. Bond Yields made 20-year highs in September, rattling markets. The 10-year Treasury yield moved from 4.80% at the start of the month to 5.23% by September 28. These are the highest US bond yields in nearly 20 years.
US unemployment rebounded sharply in September, adding 166,000 jobs. Unemployment held steady at 4.1% while average hourly earnings rose 0.3%. Weekly jobless claims held at their historically low levels in September, indicating strong jobs growth. Employment numbers have been back and forth for the last 18 months, but most measures currently indicate a stabilizing job market with solid jobs growth.
The US Economy showed solid growth in September. US GDPNow tracker from the Atlanta Fed is tracking 5% GDP growth for Q3, and retail sales surged 1.2%. Overall, the US economy seems to be showing solid growth for Q3 heading into Q4. The US economy is surprising many people with its strength after a rough patch earlier in 2026. The AI investment boom is truly historic in size, with total investment rivaling railroads, the interstate highway system, and the electrification buildout.
US inflation remained above target, with CPI coming in at 3.4% and with a strong 0.4% month-over-month gain. A large contributor was gasoline prices which rose 3.9% in the month prior. Core CPI was more subdued at 2.4%, but monthly core came in at a surprising 0.3%. Inflation remains persistently above the target, and September’s additional jump in gasoline prices will add to inflation concerns going forward. The widespread expectation in early 2026 that inflation was contained and would fall in the second half of 2026 turned out to be misguided. Inflation remains stubbornly strong in late 2026.
The US Federal Reserve hiked rates for the first time since 2023, lifting the benchmark rate to 3.75%. Above target inflation combined with signs the US economy is shrugging off energy prices gave the Fed room to raise rates. Rate sentiment has shifted sharply since September first, markets now expect a total of 4 hikes over the next year, up from 2-3 at the beginning of September.
The USD rallied to near the strongest levels of the last 2 years in response to these events. The US Dollar index gained 1.75% in September, with most of this gain coming in the last two weeks of the month. The recent jump in oil prices is much more negative for Europe and Asia than it is for the USA, as they are more exposed to energy from the Strait. This difference in energy price impact is a key factor in USD strength. Higher yields, less exposure to energy and a relatively strong economy add up to support for the USD. If oil prices remain elevated, this will tend to favor the USD going forward due to the disparity in oil price impact.
Oil prices and the Strait of Hormuz remain a large wildcard for the USD and currency markets. The key risk is oil prices: if the Strait situation worsens, an energy price-driven economic slowdown would push prices higher while also slowing the economy. This would complicate the Fed's expected rate hike path, even as inflation increases. A ceasefire breakthrough, conversely, could trigger a sharp reversal in the USD as rate-hike bets are unwound, inflation moderates and the solid US and world economy takes center stage. The raw information and tracking data from this event is among the least reliable I’ve ever seen, and it is unclear how or when this ongoing situation will unfold. The Strait remains a large and unsolved macro risk for October.
USDEUR
Source: Bloomberg Finance LP
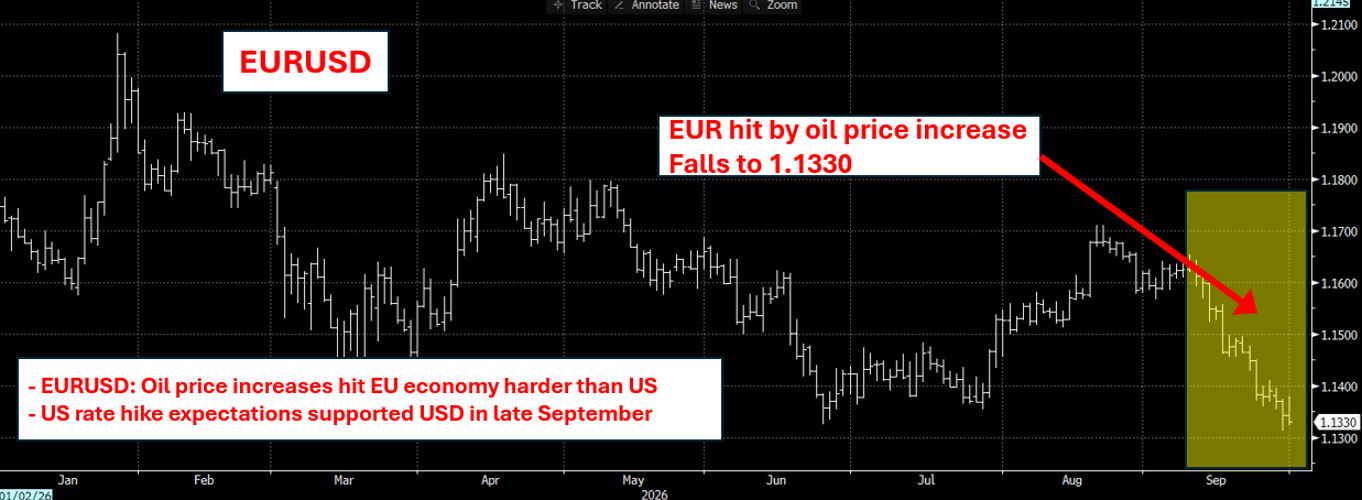
EURUSD lost 2.4% to close below the bottom of its multi-year trading range. The US shifted from expecting 2 rate hikes to 4, and European oil prices topping $120 weighed heavily on the EUR. The European economy continued to perform, and EU inflation is below the US, which is usually bullish for EUR. However, the exposure to high oil prices and the fact that the EU is nearing the end of its hike cycle collaborated to push the EUR weaker. There is a whiff of Charlie Brown for the EUR – it’s done everything right, but the EUR price had the football pulled. This exposure to what happens in the SoH could prove to be what pushes the EUR to 1.1000.
USDCAD
Source: Bloomberg Finance LP
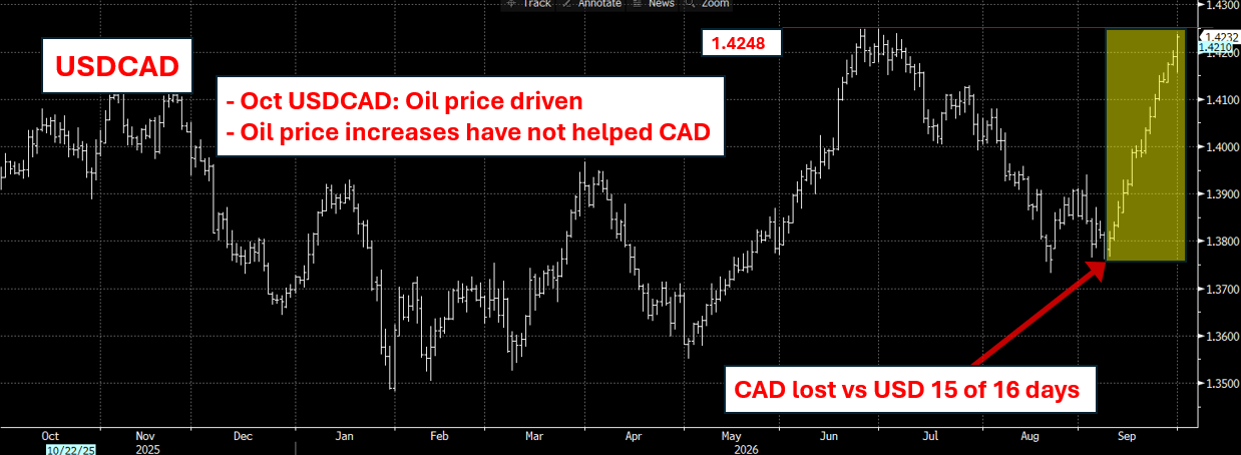
CAD had a significant move vs the USD in September, losing value in 15 of the last 16 trading days. A combination of Strait worries along with a new tariff spat reversed the prior months strength, and pushed it to the top of a multi-month range to close at 1.4242. The Bank of Canada held rates steady at 2.25% despite inflation near 3%, and the increasing rate differential with the US is a drag on the CAD. Canadian exports to the USA fell dramatically, and without the US buying Canadian goods, the CAD may break through to the 1.43-1.45 range.
USDMXN
Source: Bloomberg Finance LP
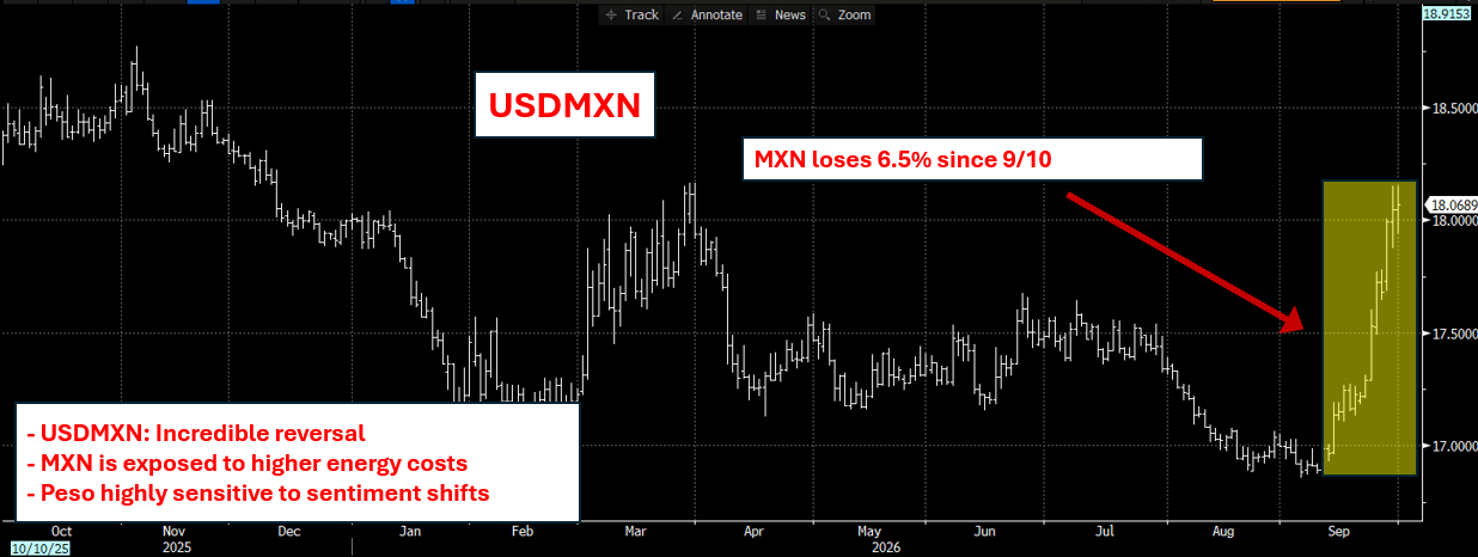
USDMXN: The peso was hit extremely hard by September news and lost nearly 8% vs the USD. Traders exited the popular “buy MXN, sell USD” carry trade when the Strait conflict and bond yields flared in September. Yet Mexico’s economy remains strong and inflation is largely where it has been for the last year. Mexico exports to the US surged 40% YoY in August, so trade appears to be normalizing, still tariffs and trade remain a dispute. The Peso remains quite exposed to Iran news.
USDCNY
Source: Bloomberg Finance LP
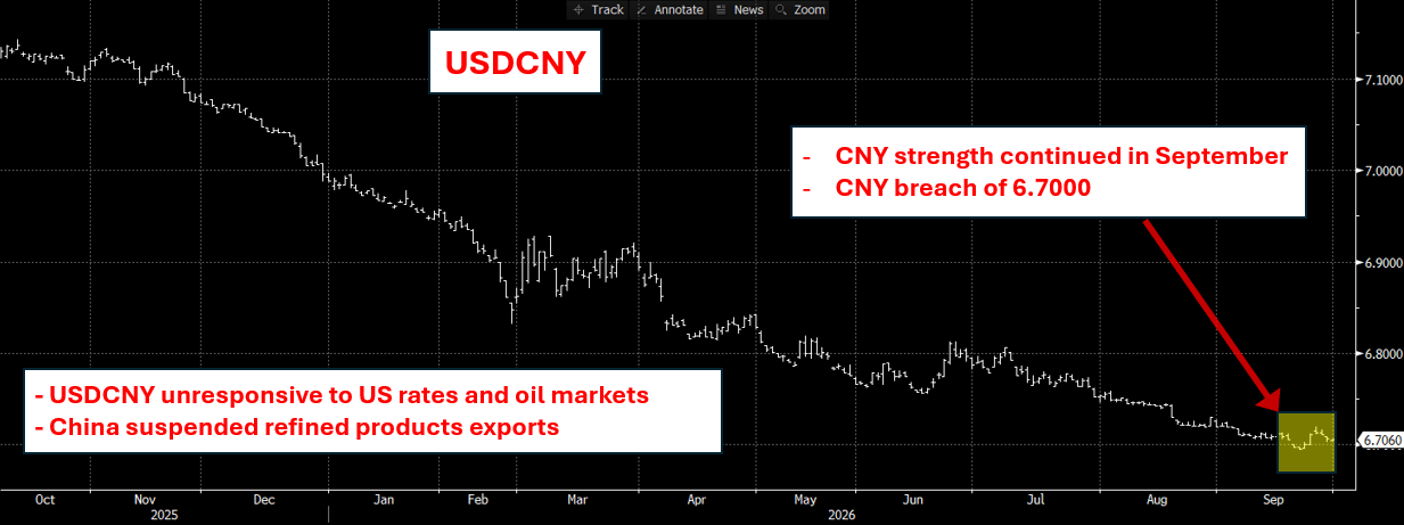
USDCNY: The CNY was the only major currency to gain vs the USD in September. The Trump-XI summit delivered a 2 month trade truce, and some tariff cuts, and in response the PBOC continued its path of setting stronger price fixings. The CNY is a semi-managed currency and these fixings guide prices. China exports surged as companies rushed to take advantage of this 2-month window. Note: This is the last shipping push before the US holiday season.
USDJPY
Source: Bloomberg Finance LP
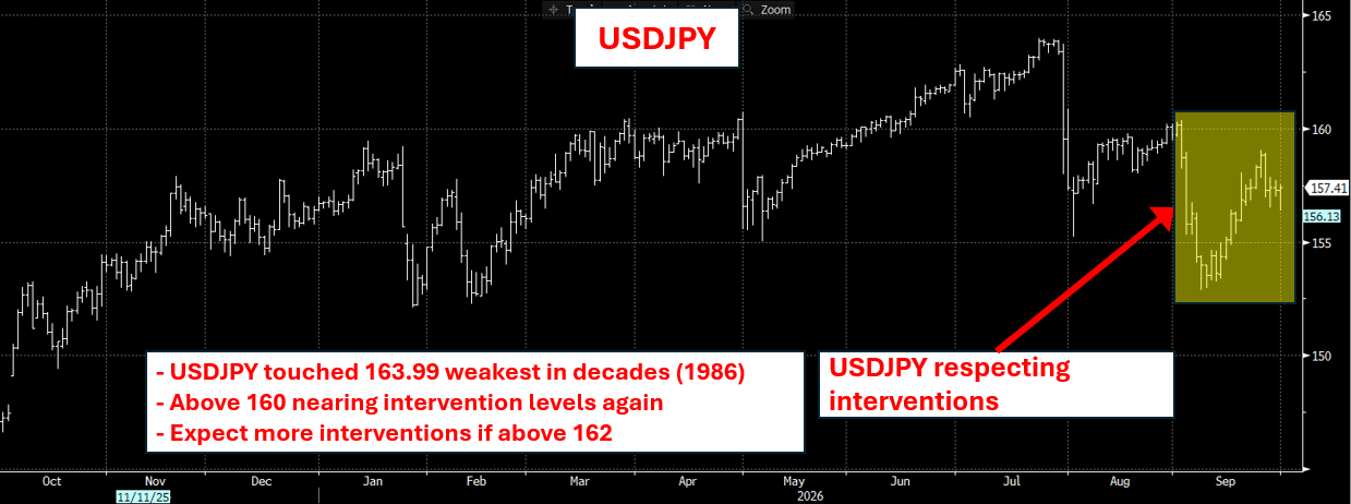
USDJPY had a large range in September as early month intervention rumors were counterbalanced with the mid-month exposure to oil and US rate hikes. Intervention in the USDJPY was rumored in early September at the 160 level, and Japan’s Currency diplomat warned markets on 9/28 Tokyo and Washington were sending a “very clear’ message on yen weakness. The BoJs 0.25% hike on 9/18 helped to support JPY sentiment, yet rates remain well below the current 2.6% inflation. Expect interventions above 160.
GBPUSD
Source: Bloomberg Finance LP
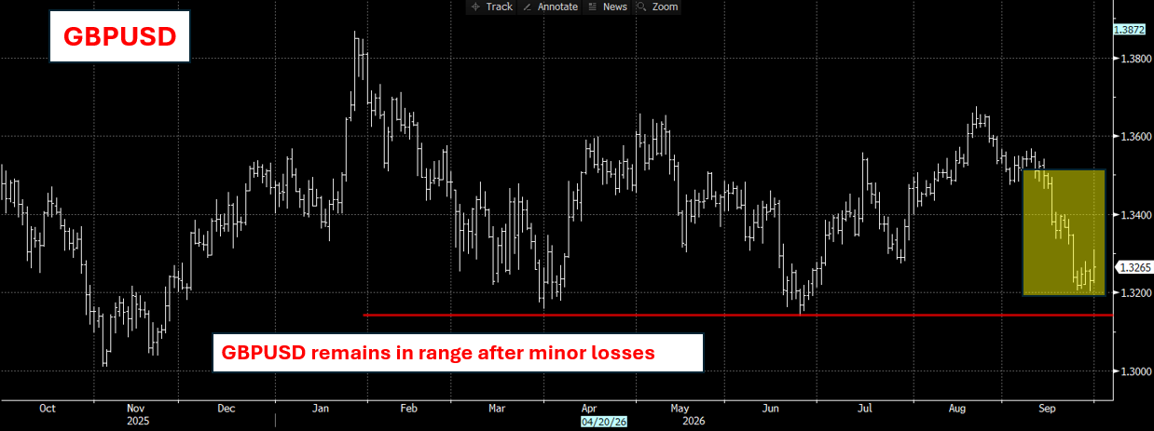
The GBP fell moderately vs the USD despite a weak economy, oil market woes and increasing inflation. Fiscal risk is a big driver of negative sentiment, yet the GBP remained relatively strong. The UK is a bit less sensitive to oil from the strait, so disruptions there are less impactful. Still, the UK lost 25k jobs, and inflation increased to 3.2%, so traders have increased bets on the GBP falling out of the range it has established over the last 12 months against the USD. This may result in a large price move if the GBP breaks below 1.3170
Associated Bank can transact foreign exchanges in more than 100 currencies. Companies interested in learning more about making payments in foreign currencies or in hedging currency exposures should contact their Associated Bank Relationship Banker or the bank’s Corporate Foreign Exchange Department at 866-524-8836 or email fxcapmarkets@associatedbank.com.
All rates shown are indications only and subject to change. Foreign exchange contracts are subject to foreign currency exchange risk and are NOT deposits or obligations of, insured or guaranteed by Associated Bank, N.A. or any bank or affiliate, are NOT insured by the FDIC or any agency of the United States, and involve INVESTMENT RISK, including POSSIBLE LOSS OF VALUE. This material is provided to you for informational purposes only; and any use for other than informational purposes is disclaimed. It is a summary and does not purport to set forth all applicable terms or issues. It is not intended as an offer or solicitation for the purchase or sale of any financial product and is not a commitment by Associated Banc-Corp, its subsidiaries or affiliates, as to the availability of any such product at any time. The information herein is not intended to constitute legal, tax, accounting, or investment advice, and you should consult your own advisors as to such matters and the suitability of any transaction. We make no representations as to such matters or any other effects of any transaction. In no event shall we be liable for any use of, for any decision made or action taken in reliance upon, or for any inaccuracies or errors in, or omissions from, the information herein. The views expressed here are solely those of the author and do not reflect the views of Associated Banc-Corp, its subsidiaries or affiliates.
